CRO and A/B testing: the maths behind the decision
What CRO is, how to write a hypothesis, how many visitors an A/B test needs before the result means anything, and why you stop only at the end. With a working clinic example.
Part of the guide: Digital marketing for small business: the whole system, in the order to build it
An A/B test compares two versions of the same page on real visitors to find out which one produces more enquiries or sales. Before running one, work out the sample size: with a 3% baseline conversion rate, detecting a lift to 3.6% at 95% significance and 80% power needs about 13,900 visitors per variant. At 1,000 visitors a day to that page, that is four weeks. At 100 a day, this test is not for you, and there are other ways to improve conversion.
CRO basics: research, hypothesis, test, measure
Conversion rate optimization is a repeating four-step process: research, hypothesis, test and measurement. It is not a list of conversion tips, and it is not changing a button colour because someone read that red converts better. The aim is to understand where visitors leave and why, change the thing that causes it, and measure whether the change helped.
- Research: where people stop, and what they do just before they leave.
- Hypothesis: one change, with a reason, and a metric that decides whether it worked.
- Test: an A/B test when there is enough traffic, another method when there is not.
- Measure and decide: keep it, drop it or try another version, and write down what was learned.

Research: where hypotheses come from
Most of the improvement comes from the research, not the test. Four sources are enough for most businesses:
- Analytics funnels: how many visitors move from the home page to a service page, to the form and to completion. The step with the steepest drop is where to start. Split by device, because mobile almost always tells a different story.
- Heatmaps and session recordings: how far people scroll, what they click, and where they click on something that is not a link. Watching 50 to 100 recordings of people who did not finish teaches more than any report.
- Form analytics: which field people stall on, what they delete, which error keeps appearing.
- User feedback: one question at the end of a flow (“What nearly stopped you?”), sales conversations, support tickets. That is where you hear the words customers actually use.
Writing a hypothesis
A good hypothesis has four parts: because we saw X, changing Y will improve Z, measured by W. For example: “Because recordings show mobile visitors tapping the ‘from’ price and then scrolling to look for detail, showing the full price and what it includes on treatment pages will raise the booking rate, measured as completed bookings divided by visits.”
Three rules. One change per hypothesis, or at least one direction, so it is clear what worked. One primary metric, chosen in advance. And guardrail metrics that must not get worse, such as cancellations, page speed or returns. We also discuss choosing the metric in a landing page that converts.
A/B test sample size: the maths in plain words
Sample size depends on four numbers:
- Baseline conversion rate (p1): say 3% of visitors send an enquiry.
- Minimum detectable effect (p2): the smallest change worth detecting, say a lift to 3.6%, a 20% relative improvement. The smaller the change, the more visitors you need.
- 95% significance: a 5% chance of declaring a difference when there is none.
- 80% power: if the difference is real, the test will detect it 80% of the time.
The standard formula for comparing two proportions is: n ≈ (1.96 + 0.84)² × [p1(1−p1) + p2(1−p2)] ÷ (p1−p2)². The 1.96 comes from 95% significance (two-sided) and the 0.84 from 80% power.
For 3% to 3.6%: (1.96+0.84)² is 7.84. p1(1−p1) is 0.03×0.97 = 0.0291, and p2(1−p2) is 0.036×0.964 = 0.0347, together 0.0638. The squared difference is 0.006² = 0.000036. So 7.84 × 0.0638 ÷ 0.000036 ≈ 13,900 visitors per variant, about 27,800 in total.
Looking for a bigger change, from 3% to 4.5% (a 50% relative lift)? The same arithmetic gives about 2,500 visitors per variant, five and a half times fewer. That is why small sites test big changes. You can check any of these in Evan Miller’s sample size calculator, which gives very close figures.
How long to run an A/B test
Divide the total visitors needed by the daily traffic to the page being tested, then round up to whole weeks. The table assumes a page with 1,000 visitors a day, half to each variant:
| Baseline → target | Relative lift | Visitors per variant | Days at 1,000/day | Recommended run |
|---|---|---|---|---|
| 3% → 3.3% | 10% | ≈ 53,200 | ≈ 107 | 16 weeks, probably impractical |
| 3% → 3.6% | 20% | ≈ 13,900 | ≈ 28 | 4 weeks |
| 3% → 3.9% | 30% | ≈ 6,450 | ≈ 13 | 2 weeks |
| 3% → 4.5% | 50% | ≈ 2,500 | ≈ 5 | 2 weeks, never under one full week |

Mistakes that make a test worthless
Peeking and stopping early
The most common one. Results are checked daily and the test is stopped the moment the new version looks significant. The problem: early in a test the numbers swing, and almost every test passes through a moment where one side seems to be winning. Stopping at such a moment declares many improvements that do not exist, a high rate of false positives. The rule: fix the sample size in advance and decide only once you reach it. If you need to look early, use a method designed for it, such as a sequential test, and set it up before launch.
Not running full weeks
Monday-morning visitors are not Saturday-night visitors. A ten-day test counts some weekdays twice and others once. Run one, two or four full weeks, and never less than one full week even when the sample fills quickly.
More than one primary metric
Check ten metrics and one of them will show a “significant” difference by chance. One primary metric decides; the others only confirm that nothing broke.
Sample ratio mismatch
If you set a 50/50 split and got 10,000 against 9,400, something is wrong: a broken redirect, a variant that loads slowly, bots counted on one side only. This is called sample ratio mismatch, and the test cannot be trusted until the cause is found. Check it before looking at the result; a chi-square test on the two counts tells you whether the gap is larger than chance.

What to do with low traffic
Most small businesses do not have 28,000 visitors a month on a single page. That does not mean conversion cannot be improved. It means working differently:
- Test bigger changes: a new page, a different offer, a three-field form instead of ten. A change of that size can move results by 50% or more, and that is measurable on modest traffic.
- Test where the traffic is: the home page or an ad, not the third step of the funnel.
- Lean on qualitative research: five to eight usability sessions with people from the target audience surface most of the obvious problems.
- Fix without testing: a form broken on mobile, a missing price, a button nobody can see. Just fix those. Not every change needs an A/B test, and sometimes the right answer is not to A/B test at all.
- Compare before and after, carefully: less reliable than a test, because seasonality and ad spend interfere, but with equal periods and good notes it still teaches something.
Ad creative is also a good place to test, because traffic is high and differences are large. We write about that in AI video ads.

Example: the Névé conversion case
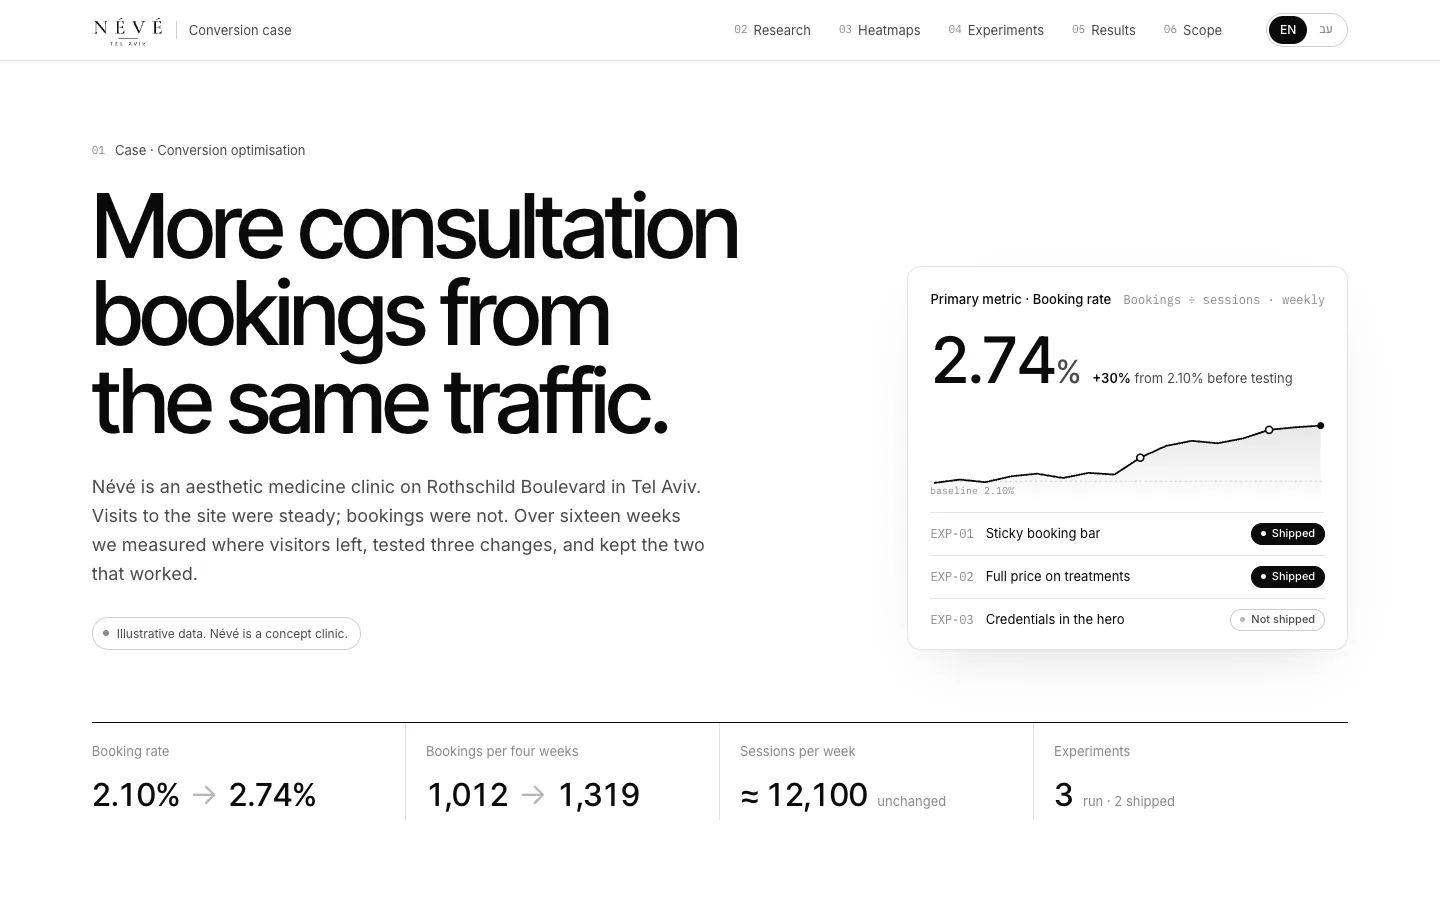
The Névé conversion case walks through the whole process for an aesthetic clinic: three weeks of research with a funnel split by device, click and scroll maps, analysis of the booking form and 240 watched recordings; findings such as mobile visitors leaving before the first price and a time picker that loses people; three hypotheses tested as A/B experiments over thirteen weeks; and two of them shipped. It is a concept we built. Névé is a fictional clinic and the data is illustrative, not evidence of a result you should expect. The clinic’s own site is in the Névé website example, and a launch page built on the same principles is the ALBA landing page.
What a programme like this costs depends on the number of pages, the tools already in place and the number of tests; the cost drivers of a site are laid out in how much a website costs. For a direction on your own site, see our websites service and send a brief; you will get a written reply by email with a direction, a price and a date.
No term matches.
Questions
How many visitors do I need for an A/B test?
It depends on your baseline conversion rate and the smallest change you want to detect. At a 3% baseline, detecting a lift to 3.6% at 95% significance and 80% power needs about 13,900 visitors per variant; detecting a lift to 4.5% needs about 2,500.
How long should an A/B test run?
Divide the visitors needed by the daily traffic to the tested page and round up to whole weeks. Never run less than one full week, even if the sample fills sooner, because behaviour differs by day of the week.
Can I stop a test as soon as it looks significant?
No. Early results swing, and almost every test passes through a moment that looks significant. Stopping then produces many false positives. Decide only when the sample size fixed in advance is reached.
What if my site has low traffic?
Test bigger changes, test on the highest-traffic pages, rely on qualitative research and usability sessions, and fix obvious problems without testing. Not every improvement needs an A/B test.
What is the difference between CRO and A/B testing?
CRO is the whole process: research, hypothesis, testing and measurement. An A/B test is one tool within it, the one that measures whether a change worked when there is enough traffic.
Getting started
Want this for your business?
Send a short brief: three required questions, the rest only if you like. We reply by email with a direction, a written price and a date.